published on December 25, 2016 in devlog
We're spending a few days of quality time with friends and family over the holidays and we hope you're doing the same. That doesn't mean we didn't get some work done the week before, though. While Martin continued to complete the population aspects of the game, Michi worked on fancy visualizations for the various data that we want to display on our universe map.
That said, we're taking a few days off of work now and will be back at it in 2017. We wish you Happy Holidays and a Happy New Year!
Martin
As planned, I continued my work on populations this week. The overall satisfaction of a population now has a direct influence on the efficiency of production facilities. The single needs that make up the overall satisfaction value fall into different categories of varying importance to the population. So if you do not provide enough water - obviously a basic need - the happiness of your staff will drop drastically. But if you don't care about providing certain luxury items, the mood will sour a bit, but your production won't grind to a halt because of it.
After hooking up the production systems to the new population code I went on to build the GUI for all of this. Firstly and most importantly, the production interface now displays the effective efficiency for any given production line. The view for a base on a planet provides you with a quick overview over population size, capacity and satisfaction. And last but not least, a dedicated population window holds detailed information about the satisfaction of the various tiers of your population down to the level of individual needs.
All of these components will probably require another round of polish - both in terms of visuals as well as tuning of the underlying formulas - but all in all, the new population system is functional enough to continue on to the next topic. As mentioned before: I'm trying to get all the important systems done to a point that one can actually play the game with all the features needed for an Alpha as soon as possible.
Michi
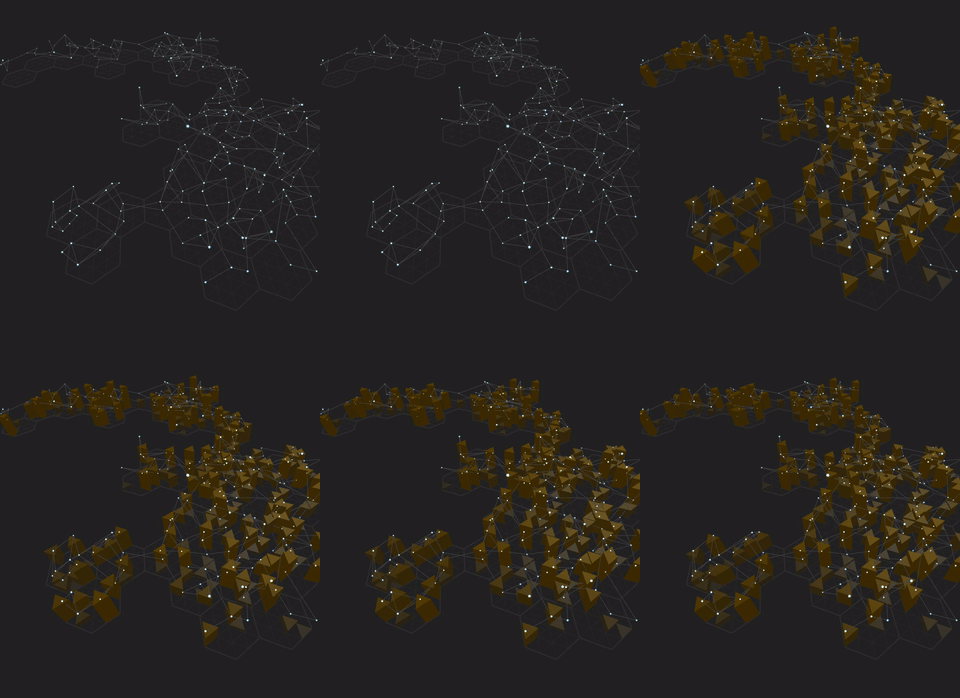
I continued to work on the visualization of the universe map. The visualization part on the client works pretty well be now. At every star position an extruded triangle can be rendered with one or more segments to represent one or two data points. The height might indicate a total value. I added animations so that the transitions between two values is not too abrupt. The following animation shows some random sample data and how the graph interpolates between various values. Keep in mind that this is just a demo, so no final colors or anything like that.
 {:width="220px"}
Random data shown on the universe map
The server side part of this is a bit trickier. Say, for example, we want to track the demand of a certain material. The client needs to be able to tell the server that it needs this data and wants it to be updated every couple of seconds or if there are changes in the data. The server then has to add the client to the list of clients that are interested in that data and has to start collect the information. In our case the information source would be every stock exchange where the given material is traded. We have a good understanding of how we want to implement the behavior on the server, but I could not finish it before the holidays.